Projections
One of the more complex topics when working with geolocated data is geographic projections and the conversion or resampling of data between projections. You may also see the term projection referred to as a Projected Coordinate Reference System (CRS) or just CRS. The below documentation can be seen as a primer, but it is still quite limited for this complex topic.
The book “Map Projections” by Battersby [1] describes map projections:
Map projection is the process of transforming angular
(spherical / elliptical) coordinates into planar coordinates. All map
projections introduce distortion (e.g., to areas, angles, distances) in the
resulting planar coordinates. Understanding what, where, and how much
distortion is introduced is an important consideration for spatial
computations and visual interpretation of spatial patterns, as well as for
general aesthetics of any map.
Spatial projections describe how to create a flat 2D version of our round 3D Earth that may be easier to work with or describe than the original representation used by our data.
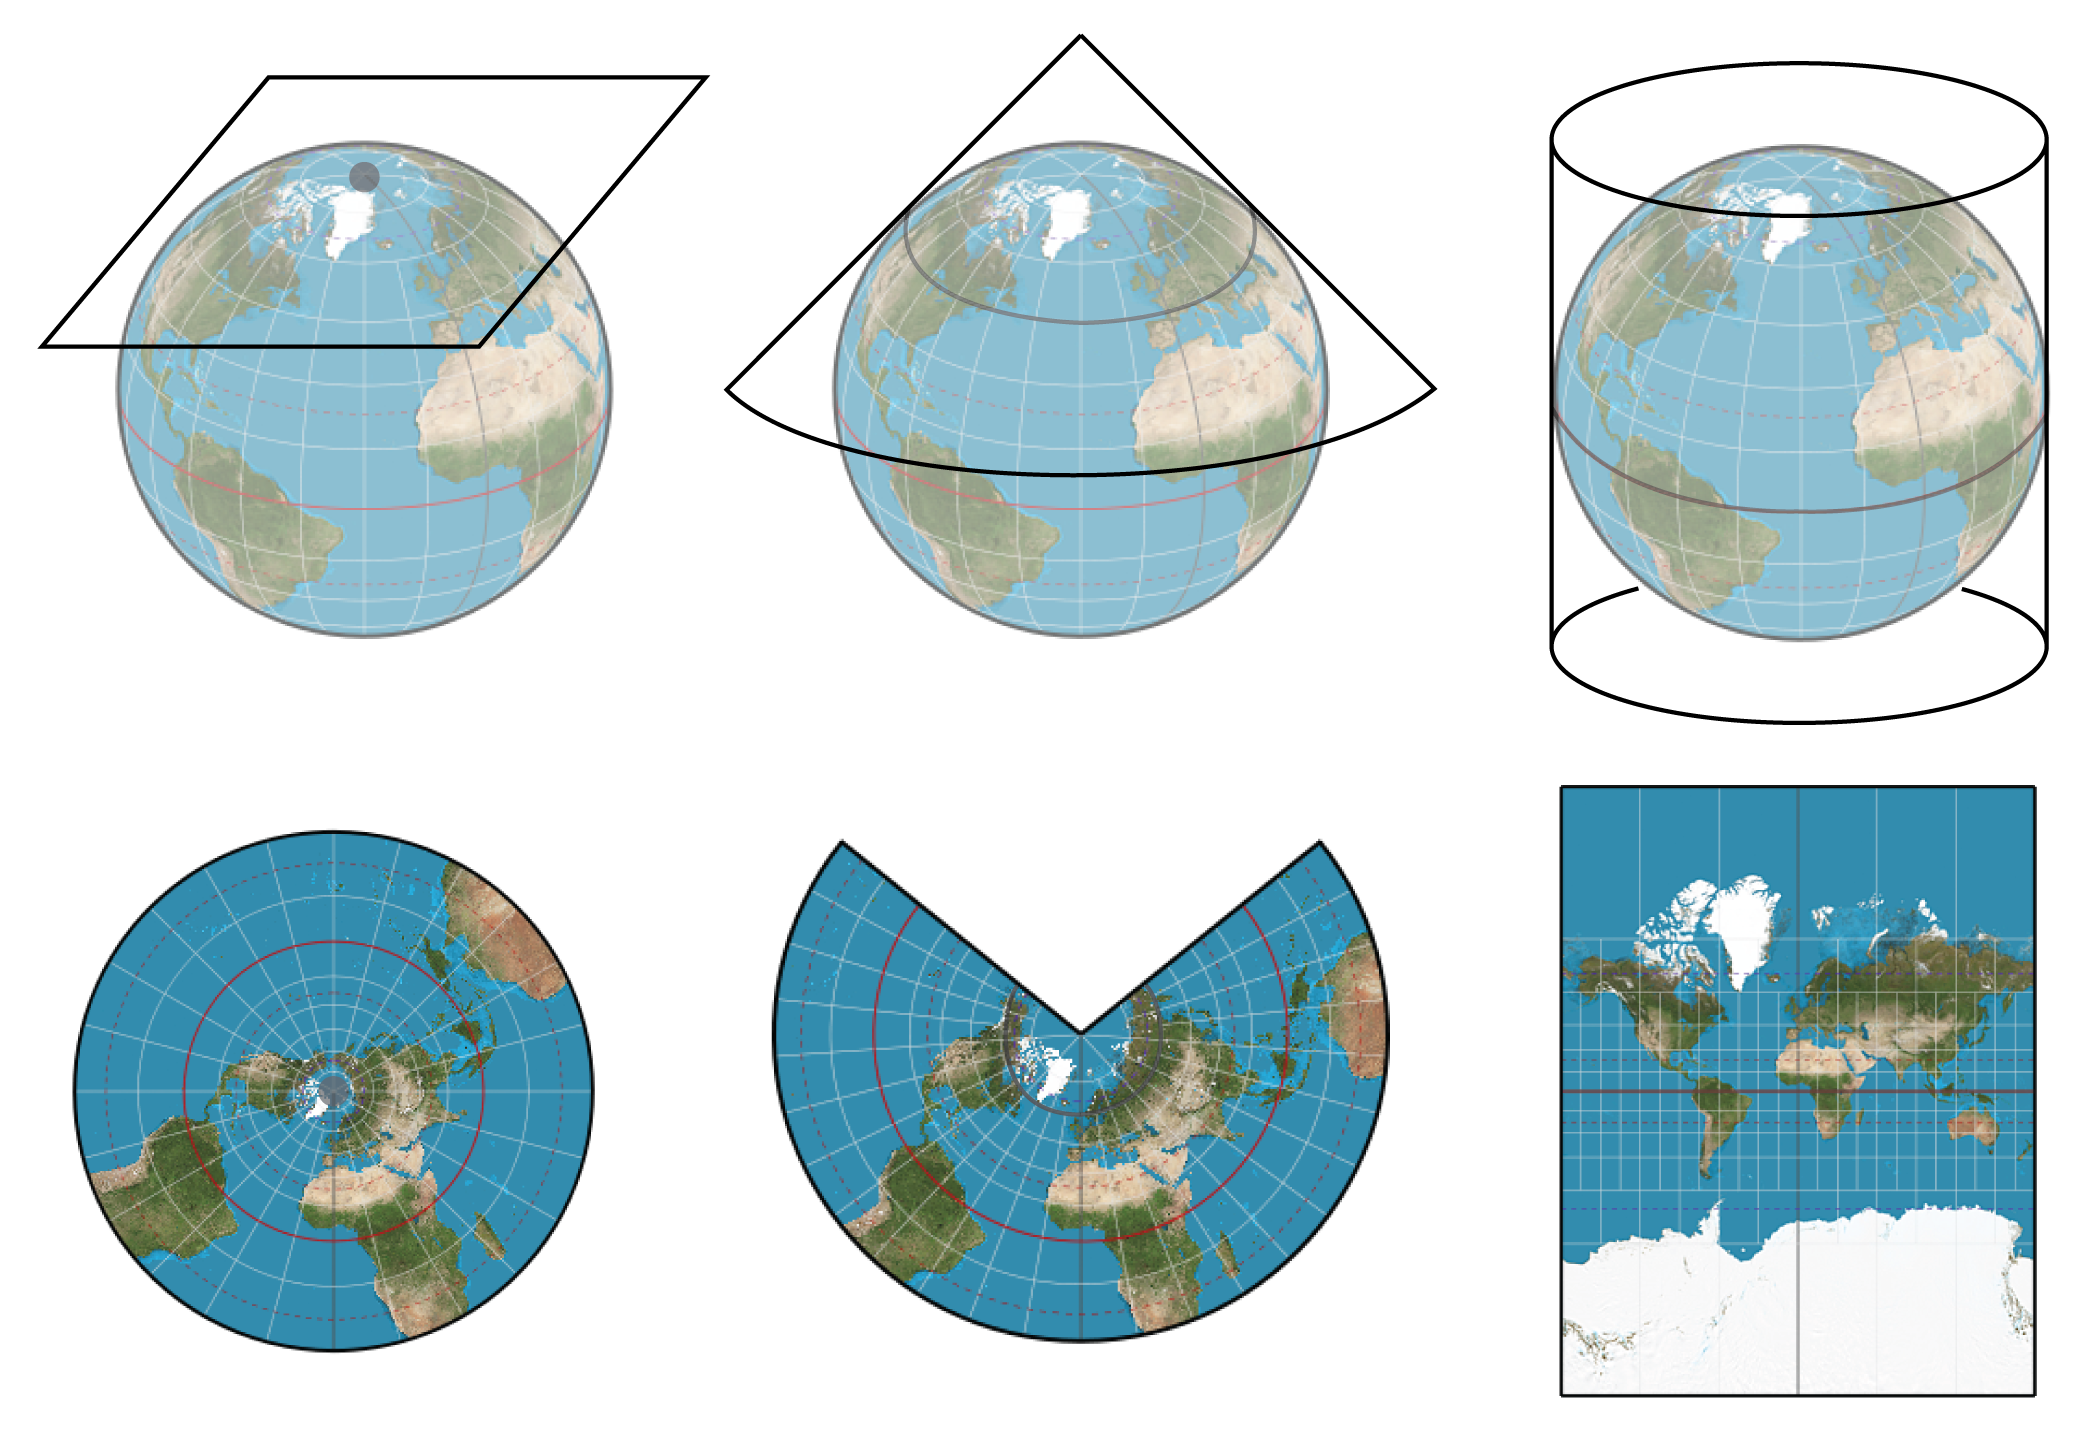
These projections or coordinate reference systems will consist of things like a model of the Earth (datum/ellipsoid), a reference or center longitude, a reference or center latitude, and the type of shape or algorithm used to transform points to and from the projection. For example, a geostationary projection might “see” the Earth like:

Or a lambert conformal conic (LCC) projection might “see” it like:

Changing the parameters for a particular CRS will change what region of the Earth is covered and what level of distortion is seen compared to the real Earth.
Properly defining the projection of your data is important in order to properly compare data from multiple sources. Two pixels at longitude 0 and latitude 0 aren’t actually representing the same location if those coordinates are defined for different CRSes. Typically to make comparison the easiest it can be coordinates are transformed or data resampled to one single CRS. For example, data from a forecast model may be defined on a longitude/latitude projection with coordinates specified in degrees. Data from a geostationary satellite might be on a geostationary projection with coordinates in meters. If you wanted to combine these data you’d need to transform the coordinates from one projection to the other.
Projection definitions
There are many different types of projections.
Geoxarray uses the pyproj library’s CRS object to define
all of its Coordinate Reference Systems and the transformation of coordinates
between them. Pyproj depends on the lower-level PROJ C++
library which defines the actual coordinate transformation algorithms and
maintains definitions for predefined CRSes (ex. EPSG codes). You can find a
list of the supported PROJ definitions here.
Anywhere in Geoxarray that a CRS is needed a CRS object
from pyproj will be used. However, these objects aren’t always compatible
with other libraries that geoxarray uses or they may not serialize well to
on-disk formats (ex. NetCDF CF). In these cases geoxarray also uses a
CF-standard “grid_mapping”
definition to persist CRS information to an xarray object and that may include
a Well-known Text (WKT) <https://proj.org/en/latest/development/reference/cpp/cpp_general.html#general_doc_1WKT2>
version of the CRS in a crs_wkt attribute. See the pyproj
Getting Started documentation for some examples of
different CRS options.
Lastly, a projection is not the only thing that is needed to describe where your data is on the Earth. Typically there are also x, or y, or other coordinate variables defining the positions of each “pixel” of your data. At the time of writing Geoxarray does not do anything with these coordinates.